The most common performance problems are in the following 4 distinctive areas:
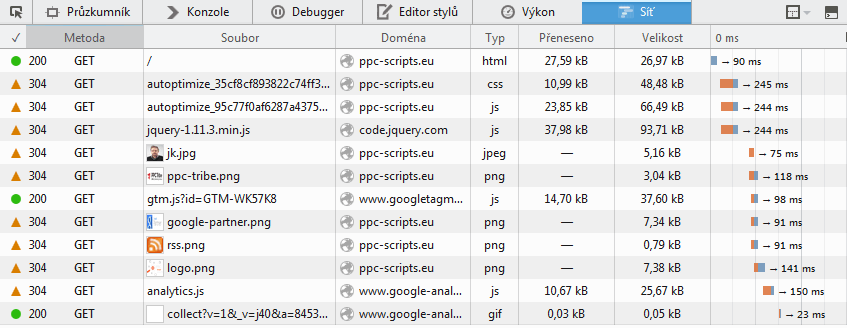
The first step in performance issues solving is use of analysis. Web page loading analysis in the form of the waterfall graph reveals us the most useful information.
There are many tools that will allow us to analyze the performance of a site:
Browser’s developer console
Online tools:
https://gtmetrix.com – this tool also provides score from Google PageSpeed Insights and Yahoo Yslow
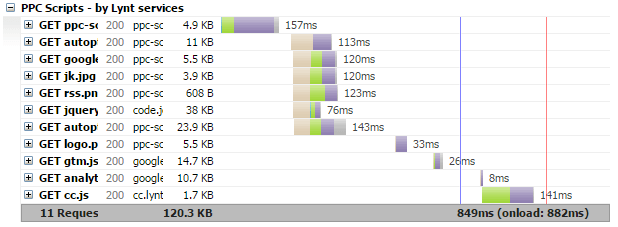
http://www.webpagetest.org/ – this tool provides detailed analysis of all requests
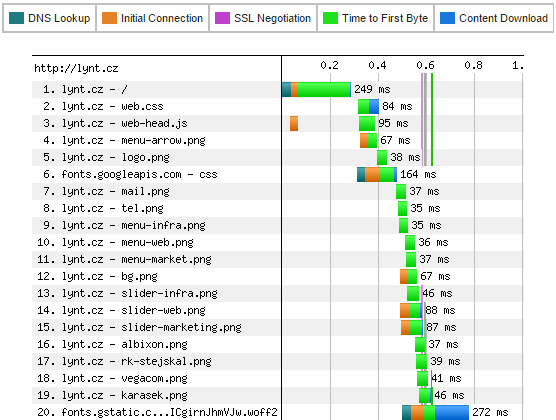
The waterfall grap can be split into two parts, code generating (the first request) a resource loading (the rest). Code generation lies on server side application (PHP scripts), and the result is HTML code. Time is spent by running scripts, communication with the database, etc.
Resources loading
Generated code commands browser to download various resources like CSS, fonts, JavaSripts, images, etc. The more resources there are the longer it takes to load the page.

It is almost impossible to determine correct values. For example photo blog uses more images in higher quality than common webpages. Guideline values (still good) for common sites may be:
- loading time under 3s
- size under 2MB
- number of resources under 50
Resource optimization is usually the quickest way to speed up your site. Image optimization is one of many optimizations that should be done to speed up your site. A recommended online service for image optimization is https://tinypng.com/, it provides really good results. The next step is to combine more JS and CSS files into one (it won’t be necessary with HTTP/2 protocol). Also make sure that Gzip compression and “keep alive” is enabled.
You can find more tricks in the presentation.
WebApp Performance
If there is problem in the first part of the waterfall – code generating – more advanced tools are required to use.
Many DB queries are common problem in case of WordPress. They are caused by huge amount or poor written plugins installed. The Query monitor plugin allows you to explore which part of WP made the most queries, spent time and many more. This plugin is also very useful during development.
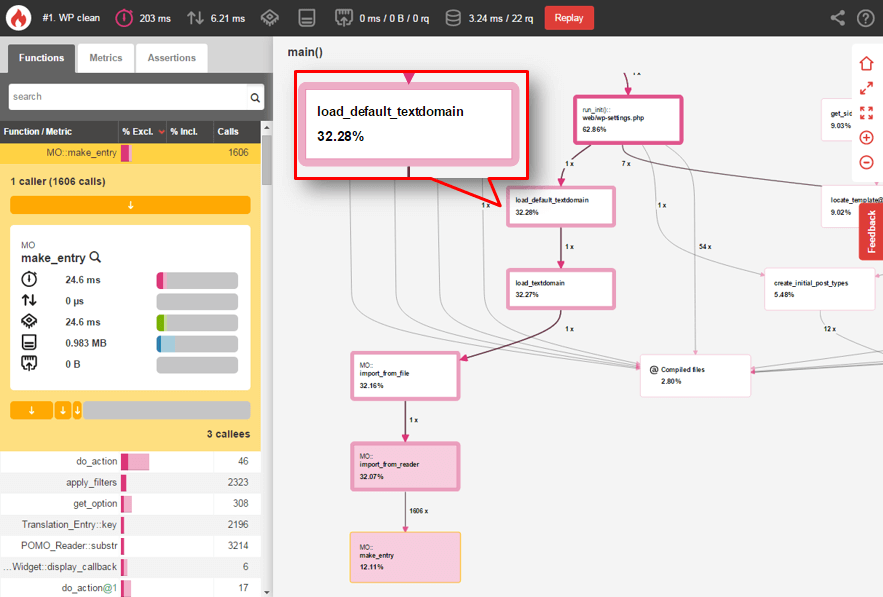
In some cases, you might need a deeper inspection of the code. In response, profilers are made to handle these tasks. My favorite profiler is BlackFire.io, it provides fantastic and synoptic visualization of code execution.
Some examples in which problems were solved with BlackFire.io include the following:
- We determined that WP spent a lot of time with loading localization – you can correct this using cache – full page cache (e.g. WP-SuperCache) or saving translation into object cache (https://wordpress.org/plugins/mo-cache/)
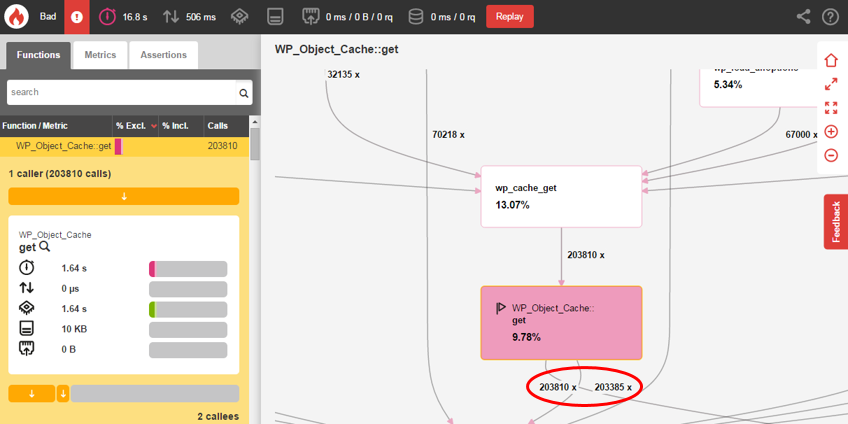
- We detected poor written plugin which performed shortcodes recursively – to get 30 objects it makes more than 200 000 call of the WP_Object_Cache:get function. This function tries to find object in the cache. Paradoxically, when we use Object Cache the situation became worse, extra time was spent on loading data from the cache. Page was generated in 16 seconds without object cache, yet it took more than 50 seconds to generate a page while object cache was enabled. However, the page was generated in under 1 second once the plgugin was replaced.
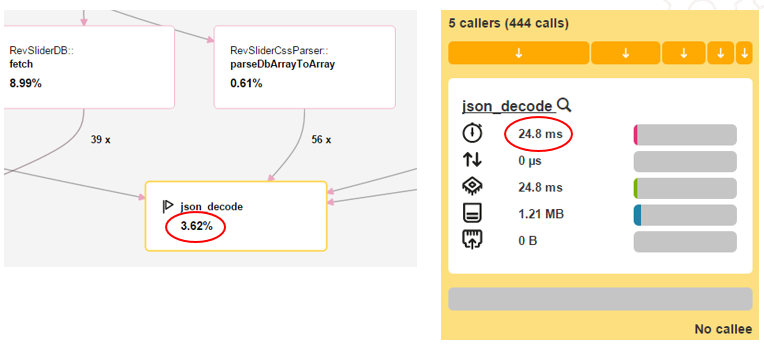
- We detected disabled native JSON module for PHP on customer’s VPS. In response, it caused the use of (slow) fallback functions to work with this format. PHP function mb_substring was called almost million times, so function json_decode takes 9,2 seconds. We enabled JSON module and then the same part of the code took only 25 miliseconds = 370x better performance thanks one line of configuration (
extension=json.so)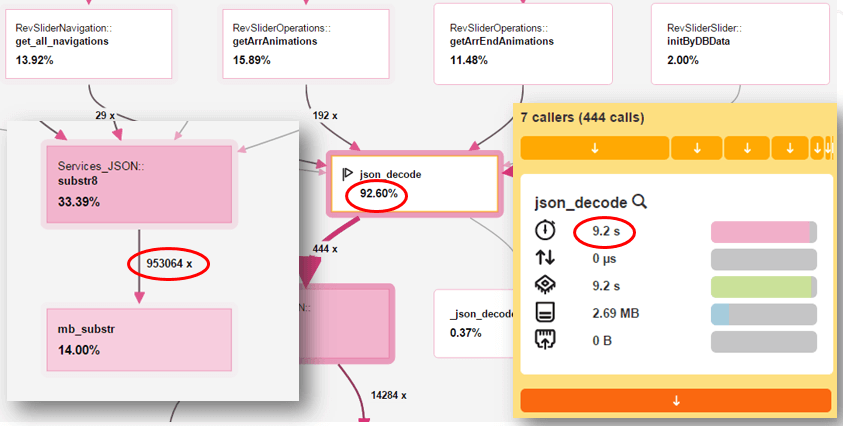
The same after the fix:
BlackFire.io comes with a quick overview over your PHP application. Installation may be little difficult (you need Linux system, install agent software and PHP extension), but your effort will be paid off soon.
You can compare profiles of WordPress in different conditions:
- Blackfire – Clean WordPress (51.93 kB)
- Blackfire – WordPress + WP-SuperCache (30.66 kB)
- Blackfire – WordPress + plugins (80.07 kB)
Server Performance
Overloaded or a misconfigured server is also a common problem. If you run on a dedicated server or VPS, you can deploy a server monitoring.
It is worth to watch values like system load, memory usage, CPU utilization (with IOwait value).
System Load
System load is quite useful, but not very specific value. System load says how many processes waiting in queue to execute in the current moment. You can retrieve this info e.g. using command “uptime” which shows 1, 5 and 15 minutes averages. When the server is overloaded you can see long term values higher than the number of your CPU cores
There are many reasons why process waits – e.g. excessive task (user) , waiting for data from HDD (the most often case – IO Wait).
It should be noted that even with the server load 2-4 times higher than the number of processor cores the server can still be working quite satisfactorily, but the server has already reached its limits. The value under 0.7x the number of CPU cores provides the smooth running and reserve for excessive tasks.
CPU utilization
You can see specific values that indicate how much % of the time are cores working. The graph is usually composed of several parts by type of utilization.
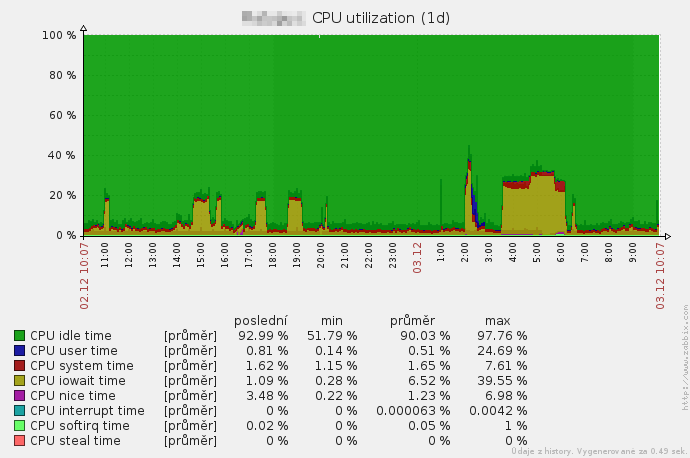
You can see the HDD intensive full backup tasks between 4 and 6 am (Zabbix monitoring).
Memory usage
If the server does not have enough of RAM, the server will start to store data on the hard disk (swap), which is slower. So, monitoring the memory usage is also important (with type resolution).
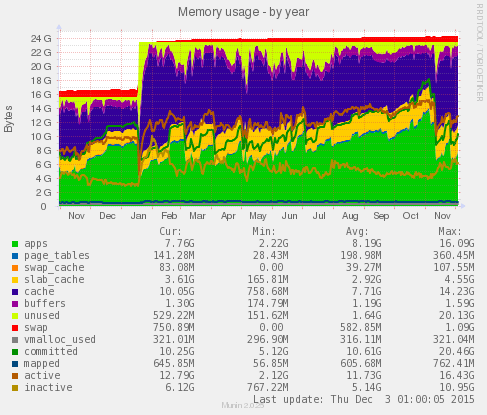
You can see server use free memory effectively for caching – we added more RAM in Janurary (Munin monitoring)
Some great tools for server monitoring include the following: Munin, Libre NMS or Zabbix.
Network Preformance
Lastly, connection issues with the server is also problem. Poor quality connections may degrade performance of your site.
A simple test to determine connection ussues is the “ping”. This tool measures how long the data travels to the destination and back – network latency. Geographical distance is important, latency between two datacenters in the Czech Republic is much lower than the latency between Czech and USA.
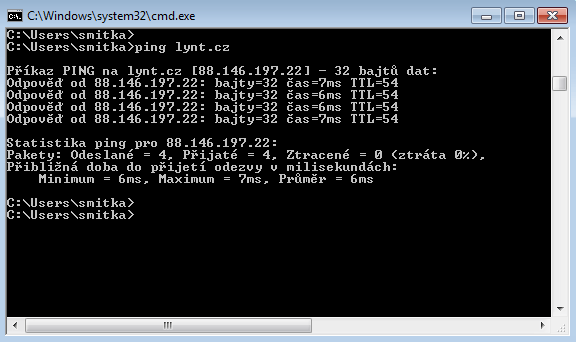
Examples of latency between some of our servers:
| Source | Destination | Latency |
| Prague (CZ) | Hradec Králové (CZ) | 7ms |
| Prague (CZ) | Frankfurt (DE) | 13ms |
| Prague (CZ) | Miami (USA) | 108ms |
In addition, the “traceroute” (tracert on Windows) tool is another useful tool. It shows the path to the destination in step by step (router to router). This tool can help you realize your data travel around the globe unnecessarily, especially when using some cloud services.
Latency testing can be useful when you choose appropriate CDN for your data or common libraries (e.g. jQuery).
Example test of some CDN’s provides jQuery library (tests were made from our server in Prague and Hradec Kralove, results from another location may differ significantly)
| CDN | Latency PRA | Latency HK | Bandwidth HK |
| MaxCDN | 9.3ms | 14ms | 2908 KB/s |
| Google CDN | 20ms | 29ms | 1640 KB/s |
| Microsoft CDN | 7.1ms | 14ms | 2052 KB/s |
| CDNjs (Cloudflare) | 1.5ms | 5.7ms | 4173 KB/s |
| jsDelivr CDN | 1.5ms* | 5.9ms | 4266 KB/s |
* 9ms with other node
You stand in front of a difficult decision whether to have static files on your server or use a CDN service. If you choose CDN, I can recommend the service that has servers in the Czech Republic (CloudFlare has) or near (Fraknfurt, Amsterdam). If you want to use a CDN for common libraries like jQuery, the best solution is to choose a CDN, which recommends the creator of the library – is the greatest chance that users will have already cached it (MaxCDN in case of jQuery).
It is not advisable to test the latency from branch and home connections, because these lines have worse performance than those between the data centers. The results can be very misleading. If you have no option to test between data centers, you can try some online tools e.g. http://ping.eu.
Performance tuning is a very complex task: the more areas you explore, the bigger is the chance that you reveal performance issues and fix them.
Full speech is available on EDU.lynt (in Czech language).
Don’t miss my huge research about WordPress in the Czech Republic (I analyzed 65 000 sites), you may be also interested in my speech about WordPress Security on WordCamp Prague 2015.
